
Note from Udo Sglavo: In many different areas of data science, we often talk about which regression technique to use. There are many other important tools outside of the regression framework. But it seems though that regression is the tool of choice. Interestingly, if you mention the word regression to a group of data scientists, it never fails to create an interesting discussion. They will passionately discuss what the concept means to them. However, the discussion will be heavily influenced by the field of their expertise and experience. We all grasp the general concept, but it seems that regression means different things to different groups of practitioners. In the first of two blog posts, I discuss the origins of regression analysis and how it works with Jan Chvosta, the director of Scientific Computing at SAS.
Udo: Linear regression has been around for a very long time. Can you discuss its origins?
Jan: The idea of regression goes back to the 19th century and the research work Sir Francis Galton did concerning the hereditary characteristics of sweat pea plants. In his experiments, he discovered that children of plants with very high weight didn’t necessarily possess the same characteristic. On average they were closer to the average population weight than their parents were. In other words, Galton observed that some extreme characteristics weren’t completely passed to the offspring but instead these characteristics tended to regress towards a standard point. He repeated the experiment hundreds of times discovering the regression to the mean principle. In addition to many other areas, today's modern regression analysis is a powerful tool also used in the field of genetics that Galton was pioneering.
Udo: Interesting story but how would you explain a regression today?
Jan: If you were to conduct a quick search for books on regression analysis, you would find many different books written on the topic. Taking a closer look, you would realize that one theme is dominant - linear regression. Simply put, linear regression is an approach that allows us to model a relationship between variables in a linear fashion. Response, also known as the dependent variable, is modeled by one or more explanatory (independent) variables. If there is just one explanatory variable, we get a simple linear regression. If there is more than one explanatory variable, we get multiple linear regression. I would start with linear regression.
Udo: What is the intuition behind linear regression? Can you explain how it works?
Jan: In the case of multiple linear regression, it provides a very intuitive explanation of how a unit change in one independent variable (say age) impacts the dependent variable (say weight), holding all other variables (age, height, gender) in the model constant. The simplicity makes the modeling and its interpretation accessible to a wild range of audiences. It also often works well in applications. The extension from a simple regression to multiple regression leads to the capability of having many covariates jointly predict a response variable. Not only does this frequently work better than simple regressions, but it also provides a better understanding of the association of variables on the outcome. Figure 1 shows The PROC REG output from a multiple linear regression of children's weight on age, height, and gender.
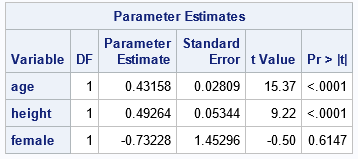
If you hold all other variables constant, it is not surprising that age has a positive impact on weight. One month of age increases the weight of a child by 0.43 lbs. There is also a positive impact of height on weight. One inch increase in height increases the weight by 0.49 lbs. Both of these variables are statistically significant from zero at a 0.01% level of significance. The regression results seem to suggest that if the child is a female, she weighs less by 0.73 lbs. However, the female variable is not statistically significant from zero at the 10% level. This small example demonstrates clearly that regression analysis can be a powerful tool.
Udo: A picture is often worth a thousand words. Is there a way to show a linear regression with a picture?
Jan: You can think of a linear regression as a modeling approach where you fit a line to data points in such a way that it minimizes departures (squared) of all points from this line. The REG procedure allows you to fit many different linear and even some nonlinear regression models. Figure 2 shows an example of PROC REG fitted linear regression of weight on age along with information about the data and regression fit.
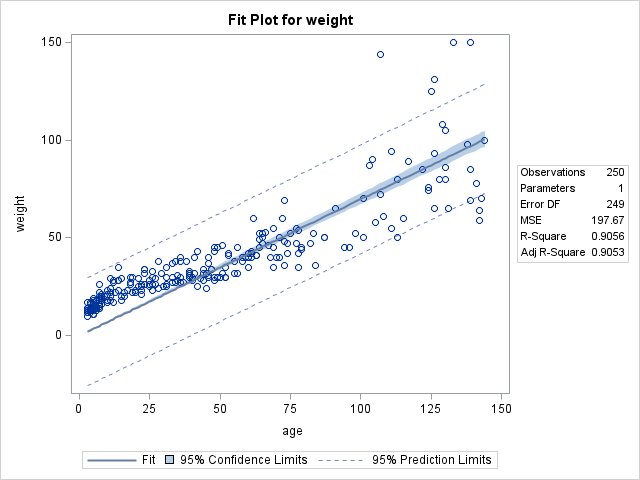
Interestingly, even this fit plot can be tied back to some of the work that Sir Francis Galton did. He was also plotting the mother and daughter pea plant data. He was trying to explain the relationship between them by putting a straight line through the data. Not having the modern software, however, it was a lot of work.
Udo: Thank you for describing the principles of linear regression. Can you elaborate more on its use?
Jan: At a very high level, the relationship between variables matters, and regression analysis can help you to explore it. Imagine you are running a marketing campaign trying to increase sales of your company. You collected the data from similar campaigns in the past and now you are trying to understand how various marketing options impacted the sales. Fitting a regression can help you to determine what marketing options (explanatory variables) had a significant impact on sales (response variable). It can also help you to predict the sales for various combinations of marketing options and find the best combination to maximize your sales.
Udo: Are you suggesting that regression analysis can be used for predictive modeling?
Jan: Yes, regression analysis can definitely help you if you are interested in predictive modeling. For example, if you think about picturing a regression in linear form with estimated coefficients from Figure 2, you just need to plug in values for your inputs (age, height, gender) to predict the dependent variable (weight). You can even get predictions for values of age, height, and gender that weren’t available in the dataset you used to estimate your coefficients.
Udo: Regression analysis has many different aspects. How would you go about learning more?
Jan: Regression analysis is a very powerful tool. You need to understand how to correctly use it. SAS® Visual Statistics and SAS® Econometrics documentation is a great resource with many examples. If you are entirely new to regression analysis in SAS, Introduction to Regression Procedures provides a great overview. In our next post. we further discuss the regression framework and choosing the correct models.
LEARN MORE | SAS Econometrics LEARN MORE | SAS Visual Statistics